Origin and Development of the Torque Correlation (Kt) Factor
Engineering manager Gary Seider explains the origin, development, and ongoing research regarding torque correlation and the Kt factor.
Today, it is generally accepted that installation torque can be used to verify the axial capacity of helical piles. The International Building Code (IBC) 2012, 2015 & 2018 Section 1810.3.3.1.9 states there are three ways to determine axial capacity. Method 2 states the ultimate capacity can be determined from well documented correlations with installation torque. The installation torque-to-capacity relationship is an empirical method originally developed by the A. B. Chance Company in the late 1950’s and early 1960’s. For over 60 years, Hubbell Power Systems, Inc. has promoted the concept that the torsion energy required to install a helical anchor/pile can be related to its ultimate capacity. Precise definition of the relationship for all possible variables is the subject of on-going research. However, simple empirical relationships, originally derived for tension applications but also valid for compression capacity; continue to be used as part of project specifications to verify capacity. The principle is that as a helical anchor/pile is installed (screwed) into increasingly denser/harder soil, the resistance to installation (called installation energy or torque) will increase. Likewise, the higher the installation torque, the higher the axial capacity of the installed pile/anchor. The CHANCE® torque correlation equation is:
Qult = Kt x T
Qult = Ultimate uplift capacity [lb (kN)]
Kt = Empirical torque factor [ft-1 (m-1)]
T = Average installation torque [lb-ft (kN-m)]
This relationship between capacity and torque was first published in professional literature by Hoyt and Clemence (1989) at the Proceedings of the 12th International Conference on Soil Mechanics and Foundation Engineering. Hoyt was the chief engineer for A.B. Chance and Dr. Clemence was a professor at Syracuse university. Hoyt and Clemence assigned values to the torque factor (Kt) and assumed it to be a constant that is primarily a function of shaft diameter. The Kt is inversely related to shaft diameter; meaning the correlation factor decreases as the shaft diameter increases. Hoyt and Clemence analyzed nearly 100 tests from 24 sites with helical anchor shaft sizes ranging from 1-1/2” [38 mm] to 3.5” [89 mm]. The test results were compared with the predicted capacity using three different methods – two theoretical methods and the torque correlation method. They found that torque correlation was statistically more consistent than the theoretical capacity methods. CHANCE subsequently determined torque factors for Type Square Shaft (SS) and pipe shaft (Type RS) sizes up to 4.5” OD.
Hoyt and Clemence worked with tension capacity. Subsequent studies demonstrated that the compression capacity was greater – sometimes over 30% more than the tension capacity. However, for practical purposes, common practice is to use the same torque correlation factor in both tension and compression.
Perko (2009) Helical Piles – A Practical Guide to Design and Installation, developed a formula to determine Kt based on the effective diameter of the helical pile. The formula was based on an exponential regression analysis of nearly 260 load tests. This formula has been added to AC358 – Acceptance Criteria for Helical Systems & Devices published by the International Code Council’s Evaluation Services (ICC-ES).
Kt = 22.285(deff)-0.9195
Deff = effective shaft diameter – typically the outside diameter of the helical pile
22.285 is a fitting factor based on the regression.
The Kt values obtained from Perko’s regression analysis corresponded fairly well to the work done by Hoyt & Clemence and other researchers. Some differences can be attributed to the different methods used to determine ultimate capacity. Hoyt and Clemence used plunging failure, but most researchers today use net displacement of 10% of the average helix diameter. Correlations have been published by the Canadian Foundation Engineering Manual (2006), and Padros et al. (2012). Theoretical correlations between installation torque and axial capacity have been reported by Ghaly and Hanna (1991); Perko (2001); Tsuha and Aoki (2010); and Sakr (2013).
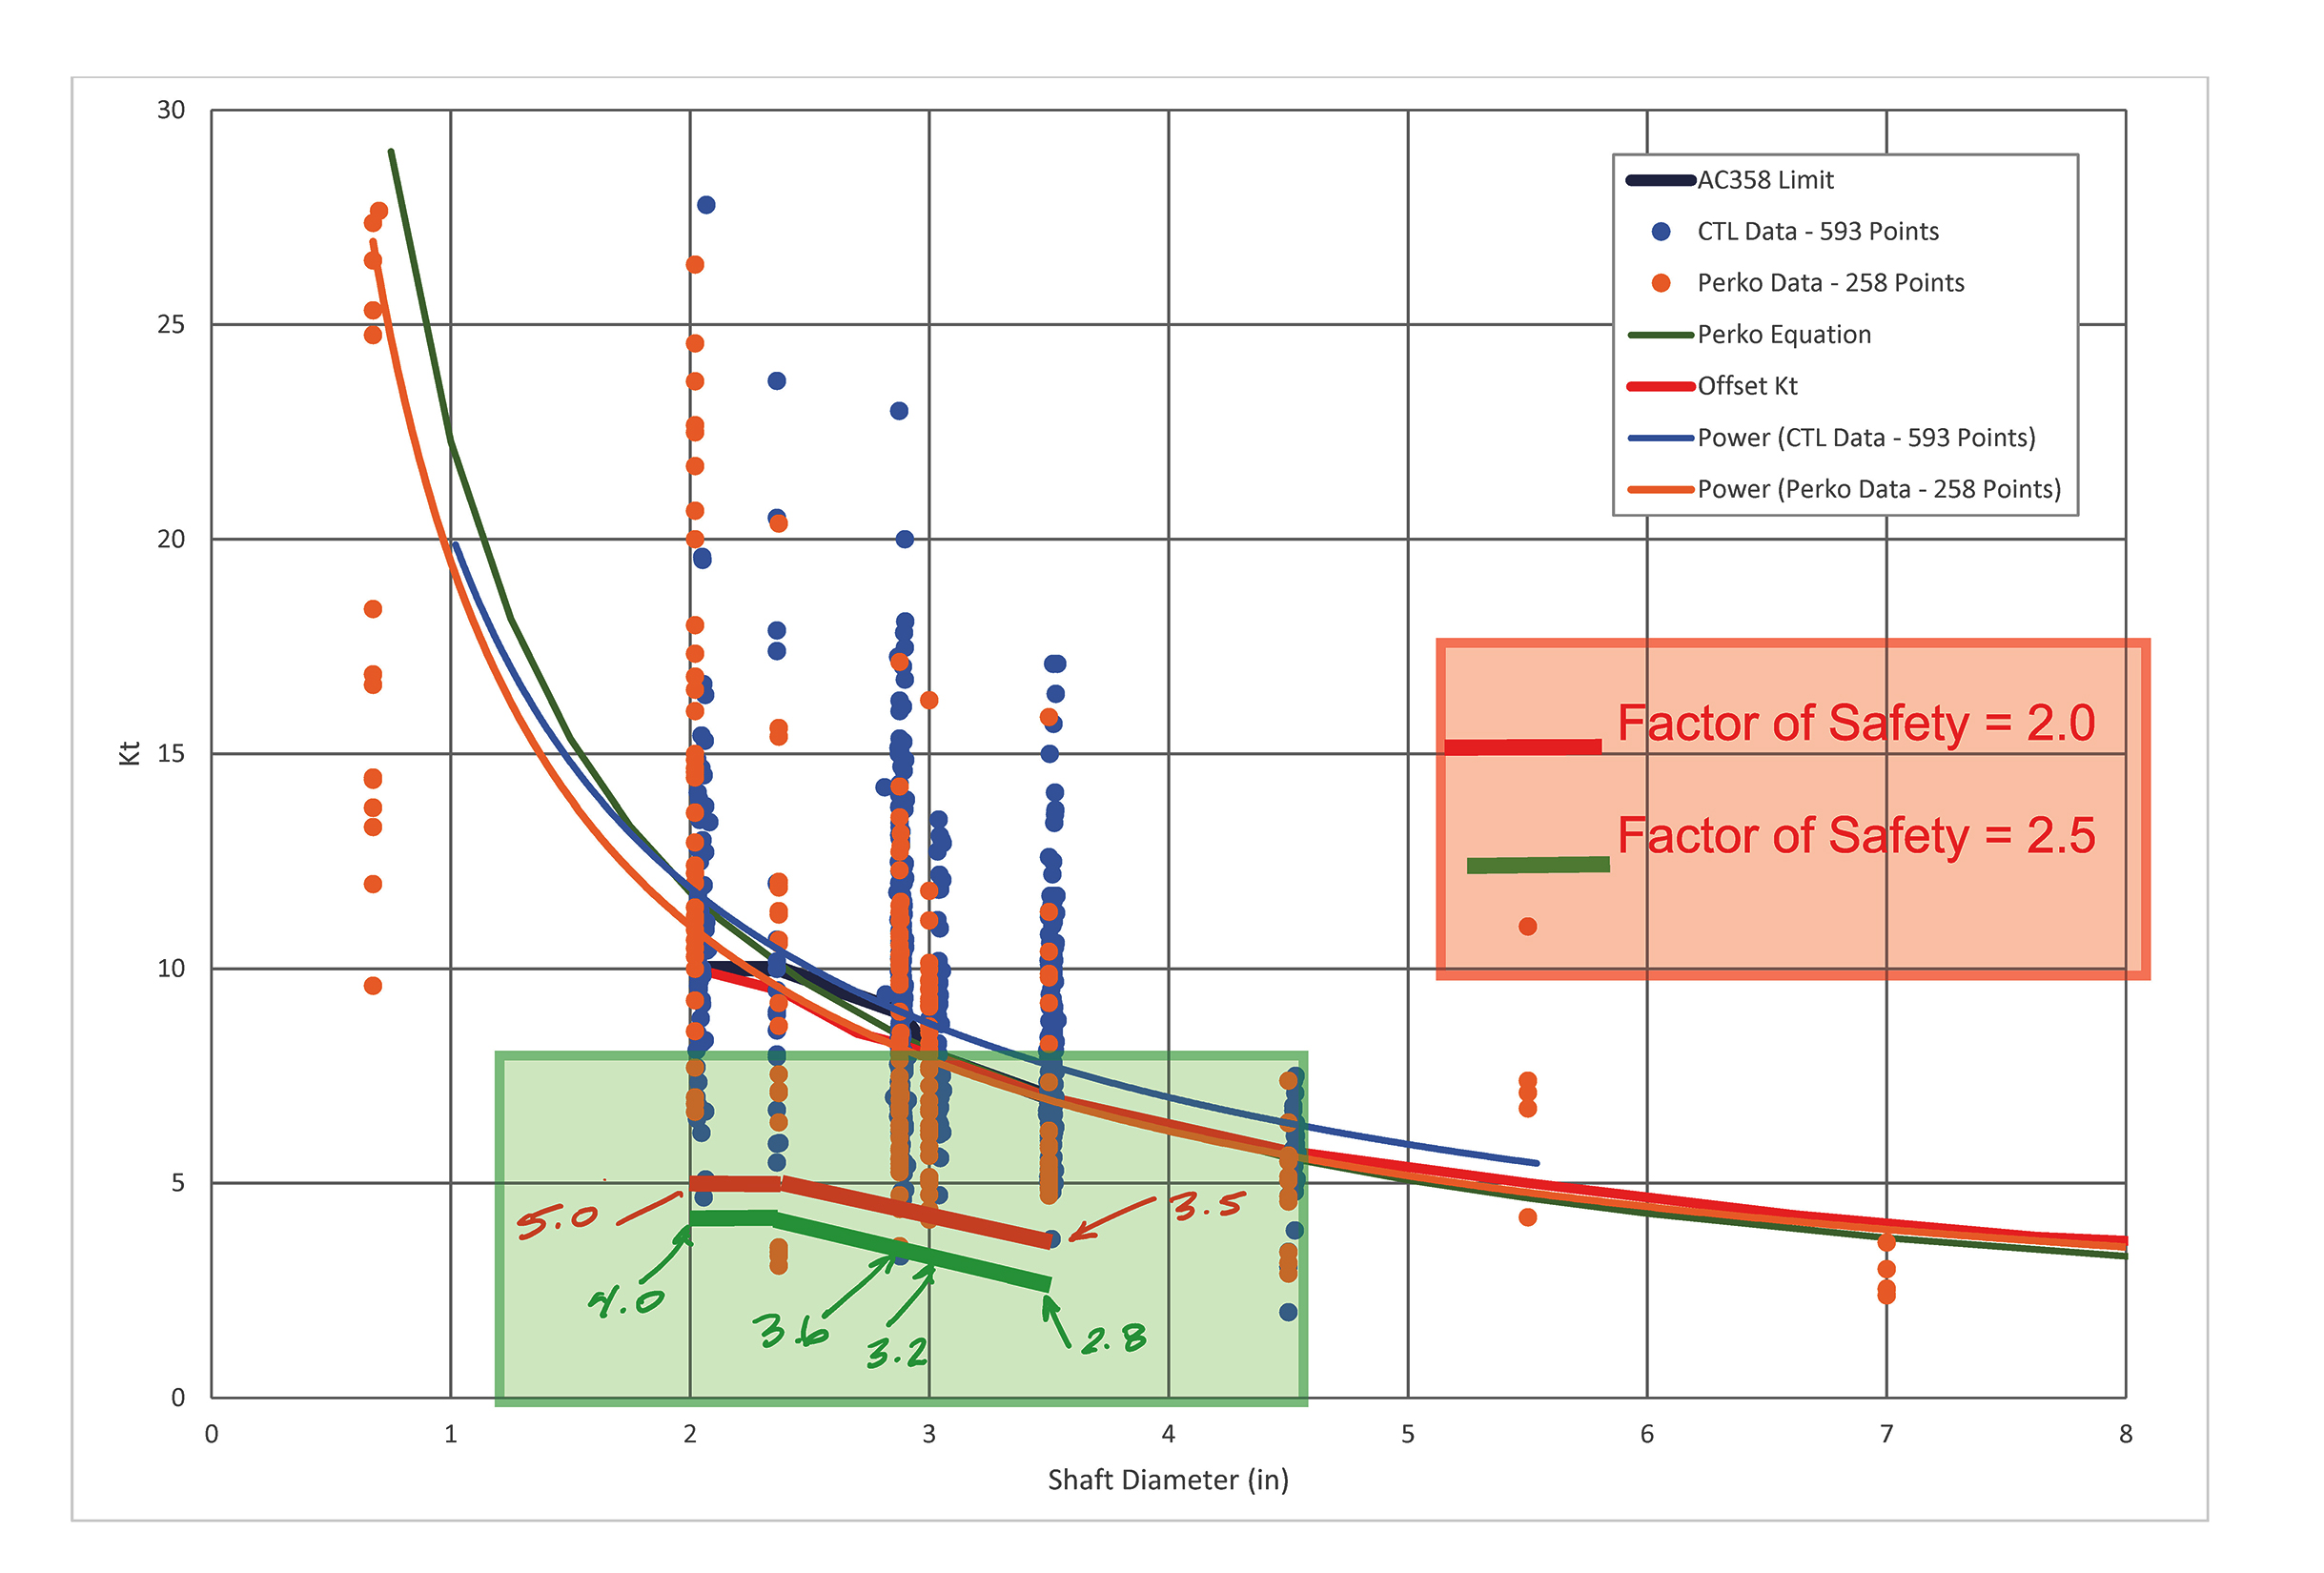
Independent accredited test lab CTL | Thompson (2016) compiled high quality test data (over 800 tests) derived from AC358 product testing of helical pile products from several different manufacturers. Hubbell Power Systems, Inc. contributed a significant amount of the high-quality test data. The following figure is a compilation of that data.

(Chart reproduced, with permission from CTL | Thompson, Inc.)
The Y-axis is the torque correlation factor (Kt). The X-axis is shaft diameter in inches. The individual points represent the ultimate capacity of a single load test. The predictive capacity curves from Perko and CTL|Thompson are shown as well as curves representing factors of safety of 2.0 and 2.5. The data points and curves support the trend of decreasing Kt with increasing shaft diameter. Most of the data is for small diameter helical piles ranging from 2” to 4.5” diameter. As can be seen from the figure, there is variation in the relationship. There are numerous factors that affect installation torque, such as soil type, operator skill level, advancement rate, crowd pressure, rotation speed, accuracy of torque measurements, shaft size, shape of pile shaft, helix pitch, etc. Lutenegger (2013) Factors Affecting Installation Torque and Torque-To-Capacity Correlations for Screw-Piles and Helical Anchors cautioned that torque correlation should not be used exclusively as the only predictive method for capacity. Lutenegger recommended it should be used with other predictive capacity methods to result in a statistically relevant and reliable design. A factor of safety of 2 is typically used to design helical piles for permanent structures. As can be seen in the Figure above, very few data points fall below the FOS of 2 line.
Torque correlation research continues by several researchers in different countries on helical piles of many different sizes and for a variety of applications. Hubbell Power Systems, Inc./CHANCE will continue to lead the effort.
Recommended Posts

How to Specify Helical Piles: A Practical Guide for Engineers

Streetlight Foundation Design: ASD vs. LRFD Explained
