6 AMI Benefits Beyond Billing for Gas Utilities
With AMI data, utilities can improve safety and identify abnormal usage patterns that could imply gas leaks. Learn more

Now what?
In the past, you had one data point each month from your manual or drive-by reads. Now you have twenty-four reads a day. That’s 720 reads in that same month! You now have a mountain of data that is begging to be used. This is where analytics comes into the picture.
What can gas data analytics do for you?
- Allow customers to view and analyze their usage and look for cost savings
- Improve safety by seeing abnormal usage patterns that could imply a gas leaks
- Identify abnormally high usage and notify the customer proactively rather than wait for a high bill to trigger a complaint call
- Provide a soft close for move in/move out situations
- Reduce truck rolls by finding causes of high bills through the data rather than a site visit
- Determine consumption patterns that indicate possible theft
Taking a Look at Patterns of Consumption with AMI data
AMI data can help you understand consumption patterns, for example:
Easily spot anomalies
The typical normal occupied consumption pattern shown in Figure 1 is relatively consistent usage over time. By understanding what a typical pattern of usage by furnaces, water heaters, stoves, and other household appliances is, a utility can easily spot anomalies.
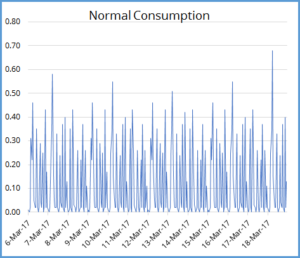
Figure 1
Identify when unexpected usage occurs
Analysis of usage patterns can help utilities identify when unexpected usage occurs. Figure 2 below characterizes a location where a soft close was employed and later constant consumption was detected. Without the hourly data, the utility would not have noticed the usage until much later. Early detection minimized lost revenue.
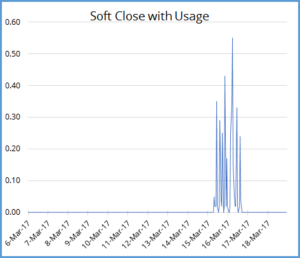
Figure 2
Alert and notify customers about unusual usage
When an appliance such as an outdoor barbeque grill is left on, illustrated in Figure 3, constant consumption will spike. In the case illustrated, the utility noticed the high usage and notified the customer, who shut off the device. This resulted in only a couple of days of high usage rather than potentially weeks before it would be noticed. The consumer was happy with the notification, providing the utility with a positive interaction rather than a negative one when a high bill was received.
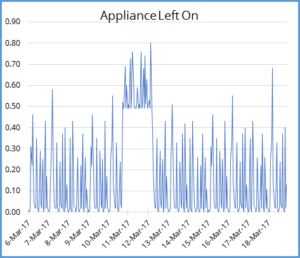
Figure 3
Gas leaks
Gas leaks are indicated by constant usage outside the bounds of a normal consumption pattern. It is apparent from the pattern in Figure 4 that there is constant usage below the peaks and valleys of normal usage.
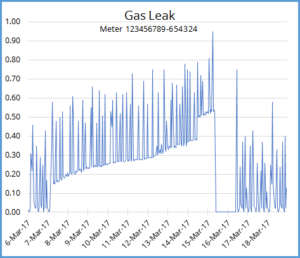
Figure 4
To sum up
These examples only scratch the surface of what you can do with AMI data. Utilities can analyze it to improve safety and identify abnormal usage patterns that could imply gas leaks. In addition, they are finding new ways to utilize the vast amounts of data they are gathering every day to improve their operations, increase customer satisfaction, and reduce greenhouse gas emissions from both methane leaks and CO2 from vehicle operation.
Recommended Posts

AMI + Analytics curb water loss and boost the bottom line

Beyond billing: AMI is a utility management game-changer
