What Utilities Can Learn From the Science Behind Black Holes
The story behind the recently taken image of a black hole – the story of how humans managed to see something so far away that it takes light 54 million years to get there – is a fantastic engineering story, as well as a scientific one. And one utilities can learn from.

Last month, astronomers made big headlines when they announced they had successfully imaged a black hole for the first time ever. This is more than just a really cool picture, it has some very important scientific ramifications. Black holes were first suggested by Karl Schwarzchild about one hundred years ago when he realized they were mathematically predicted by Einstein’s general theory of relativity. Saying something exists only because the math tells you it exists, though, is a long way from actually observing it. The math could, after all, be wrong. Indeed, Einstein’s math in particular was seen at the time as being particularly suspect because of its bizarre predictions. Almost immediately after he published it physicists set about trying to disprove it. As early as 1919 astronomers showed that light is bent around the sun by observing the apparent positions of stars during a solar eclipse. This vindicated the more pedestrian claims in Einstein’s theory, but people were still rightly skeptical of Schwarzchild’s claim about the existence of black holes. They are really strange things and as Carl Sagan said, “extraordinary claims require extraordinary evidence”. Gradually the evidence began to accumulate and one by one physicists came to agree that yes, black holes probably do exist. But still, nobody had ever actually seen one. That all changed last month with this image.
There can now be no question that Einstein and Schwarzchild had their math right.
A Lesson for Utility Engineers
But when I look at this picture, I see more than just a great scientific discovery. The story behind this image – the story of how humans managed to see something so far away that it takes light 54 million years to get there – is a fantastic engineering story, as well as a scientific one. And, believe it or not, it actually teaches a lesson that utility engineers should take to heart. To explain why, though, I need to explain a few basic facts about how astronomers use radio waves to image objects in space.
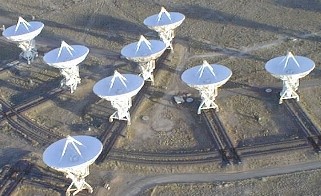
This is something I have a little bit of experience in. Early in my career as a graduate student I was working as a research assistant in the astronomy department at the University of Illinois. I was actually a student in the electrical engineering department, but I wanted to work on image processing problems in astronomy (instead of compressing the same images every other EE was working on at that time). One of the problems I considered was data collected from the Very Large Array, or VLA.
This is an array of huge antennas, each one 82 feet in diameter, mounted on tracks in a Y configuration. The tracks make it possible to move the antennas around, which is important because the spacing between antennas drives the resolution of the image. The farther apart they are, the more resolved the image produced becomes. The tracks on the VLA are each about 13 miles long making it possible for the two most distant antennas to be 22 miles apart. This gives the overall array a resolution of 0.04 arcseconds, which takes up about the size a football field would take up on the moon if you were to look at it from the Earth.
Now, that red glowing disk around the black hole is about 0.011 light years in diameter (which is huge), but it’s 54 million light years away. That makes its angular size on the sky about the same as what an orange sitting on the surface of the moon would take up when viewed from Earth. You can fit a lot of oranges inside a football stadium, so a lot of black holes would fit inside just one pixel of an image created by the VLA. Obviously, we need to place the antennas farther apart if we’re going to have any chance of imaging this black hole. Very far apart… like on different continents.
Enter the Event Horizon Telescope: a planet-wide array of radio telescope arrays.
The EHT combines data from radio telescopes in Europe, North and South America, and Hawaii to produce an aperture as big as the planet Earth itself which has a combined resolution many orders of magnitude greater than the VLA. The idea is simple: point all these telescopes at the black hole at the center of M87, collect the signals from every antenna in every telescope array, and process that data as if it were from a single array.
The devil is in the details, however. The signal is very weak (it is 54 million light years away) and the antennas have to stare at it for a very long time. That makes the amount of data each array generates immense. Also, all the signals from each antenna have to be time stamped so they can be processed as if they were connected to the same electronics. The imaging team, using an algorithm written by computer scientists, saw to these details and solved the problem handsomely.
Fact: Arrays of Sensors are Better Than the Sum of Their Parts
All this demonstrates a fundamental fact in sensor signal processing. Generally speaking, it is better to have a lot of medium quality sensors than it is to have a few very high-quality sensors. It’s true that each of the composite radio telescopes in the Event Horizon Telescope are very high quality, but that isn’t what made this image possible. It was bringing together many sensors from around the planet to look at the black hole, and then process their data collectively, that sparked this innovation. So, what I see when I look at this image is a dramatic demonstration of something signal processing engineers have known for some time: sensor arrays are better than the sum of their parts.
There is no shortage of demonstrations of this. If you’ve used Google Maps to navigate your way around traffic jams you’ve benefited directly from it. When you use Google Maps, if you have your location services turned on, your phone reports back to Google your location and velocity. The same is true of everyone else in traffic that is using Google Maps. So, in any given traffic jam, it’s an almost sure bet that there are more than a few phones reporting back to Google that they are not moving as fast as they should. Google then surmises that traffic on that part of the highway is moving slowly and warns other users.
Essentially, they have turned all our phones into a gigantic traffic-sensing sensor array. What makes it work so well is the fact that so many people use Google Maps and are reporting that data. If the number of users were much fewer there wouldn’t be enough data to make the correct inferences.
How Can Utilities Benefit?
Some utilities are starting to take advantage of large sensor arrays too. If you think about it, the vast array of meters and monitors present on any electric, gas, or water distribution network can be considered a large sensor array.
A meter measures the flow of your product at a customer point and relays that information back to your computers. On a gas network, there may be sensors that measure the concentration of methane in the neighborhood of the sensor. On an electric network, feeder-level sensors measure real-time current and voltage waveforms at strategic choke points.
SCADA equipment measures the same, but at the substation. All of this data is available to utilities to draw from, but in most cases, the sensor data is still used independently of other sensors when drawing conclusions. Is there a gas leak at a given point? Check the methane sensor at that point (even though the many gas meters nearby may provide complementary information on the same leak).
Likewise, when a fault occurs on an electric network the SCADA equipment or feeder level sensors that recorded the current transient are examined. Nearly every meter on the network would have at least recorded a voltage dip if it didn’t lose power entirely. This data is generally ignored. And with good reason. There is a lot of it for one thing. Mining through all that data to find the one little thing you are looking for could rightly be compared to looking for a needle in a haystack.
A Sensor Array that Detects Water Leaks
Aclara’s acoustic leak detection technology – ZoneScan – is one example where water utilities are using large sensor arrays to detect water leaks before they become a problem. The idea is pretty simple: use microphones to listen for water leaks (because water leaks are noisy). Now, with just one microphone, you might be able to hear a leak, but you would have no idea where it is.
Try covering up one of your ears so you can only hear out of the other and you’ll see what I mean. With one ear you lose sense of which direction sounds are coming from. With ZoneScan we place sensors throughout the water network so that no matter where the leak is it’s pretty much a sure thing that several of the microphones are going to hear it. We time stamp that data and process it using an algorithm that isn’t that much different from the one used by radio telescopes to image black holes and you can tell where on the network the leak is.
Sensor Arrays for Electrical Distribution Networks
For electric utilities, we have the Aclara Fault Detection & Localization software package, which uses the TWACS communication system to detect power outages. Here, the sensor array consists of every meter on the entire network. Data is collected from each of the meters semi-randomly using a statistical algorithm developed in the Aclara R&D lab. The purpose of the algorithm is to quickly find meters that may be without power and verify the outage by pinging other meters in their vicinity.
This approach differs from many outage detection systems, which will designate a small subset of meters in a system as bellwether meters and ping those more frequently. The idea behind this is that if a recloser trips one of the bellwether meters will see it and since the number of meters sensed is fairly small, communications will not suffer. However, this introduces several other problems, such as causing confusion when one of the bellwether meters loses power for reasons other than an upstream recloser tripping (believe me, it happens!). Sometimes smaller outages are missed that are not the result of a recloser tripping because the outage did not affect a bellwether meter.
By comparison, Aclara’s algorithm looks at all the meters and considers all possibilities while using mathematics to minimize the impact to the communications bandwidth. The very first time we turned the system on at a customer site we almost immediately detected a downed power line that the utility’s existing outage management system had not seen.
Some of our customers are using their own versions of sensor array processing to solve problems using Aclara’s Grid Monitoring (AGM) solution. This uses line sensors and software to provide real-time data that alerts operators to potential problems on the network. The sensors easily clamp onto medium voltage feeders and provide voltage and current waveforms. Signal processing algorithms on board the sensor detect when a statistically anomalous event has occurred, say a transient that may have caused a recloser to open. When that occurs, the sampled waveforms are transmitted to the utility and an alert is sounded. By examining the data from even just one sensor it is possible to predict outages and locate major faults before they even occur. But if the utility has multiple smart grid sensors along the same feeder it is very likely that the same disturbance was recorded by several sensors. By examining the data from all the sensors collectively, it is possible to infer several things about the transient, such as where it occurred, how many customers it affected, and which, if any, protective devices were affected.
Conclusion
This is just a glimpse of what we believe is ultimately possible by bringing multi-sensor signal processing to bear on gas, water, and electric distribution problems. Many of the things I’ve mentioned here will be discussed at the upcoming #AclaraConnect 2019. While I don’t know exactly what he will talk about, I would be very surprised if Dr. Michio Kaku, as a theoretical physicist, didn’t at least mention black holes in his keynote.
Recommended Posts

AMI + Analytics curb water loss and boost the bottom line

Beyond billing: AMI is a utility management game-changer
